Linear Equations in Two Variables
In this section we will examine equations in x and y where both variables are
raised to the first power.
Definition: Any equation that can be written in the form
 , where A and B are not both 0, is
called a linear equation .
Question: According to the definition, which of the following are linear
equations?

Answer:
a) Yes.  . x and y are raised to the first
power .
. x and y are raised to the first
power .
b) Yes.  can be written as
 , so that
  .
A and B are not
.
A and B are not
both 0, the variables are raised to the first power.
c) Yes.  can be written as
 . Both variables are
raised to the first power.
d) No. x is raised to the second power.
e) No. y is raised to the second power.
Linear equations can be graphed as any other equation by
plotting points.
Example 1: Graph the linear equation  .
.
Solution: Solve for y . 
Notice that all of the points were on a line. You might
guess that this is why these equations are called linear
equations.
The graph of any linear equation is a straight line. Because any two points
determine a line, we can graph a
linear equation by plotting at least two points. The intercepts are a good
choice because they are usually easy
points to find.
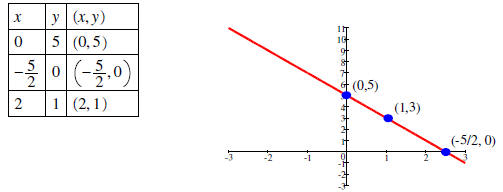
Question: What are the x- and y-intercepts of the above graph?
Answer:
• y-intercept: Substitute  or (0,3)
• x-intercept: Substitute  or
or
Example 2: Graph the linear equation
 .
.
Solution: Solve for y: 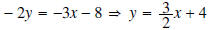
|
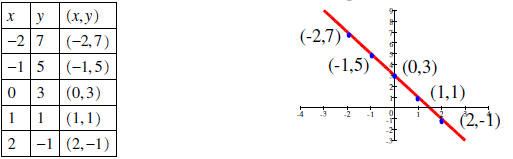
Make a table of values: |
Plot the points and draw the line: |
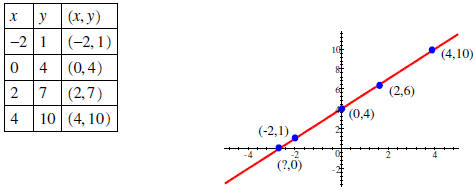 |
We can see from both the table and the graph that the
y-intercept is 4.
Question: What is the x-intercept?
Answer: If  . The x-intercept is
 .
.
Example 3: Graph the linear equation
 .
.
Solution: We recognize that is a linear
equation.
|
Make a table of values: |
Plot the points and draw the line: |
 |
Example 4: Graph the linear equation
 .
.
Solution: We recognize that is a linear
equation. Solving for y: 
Note that the equation does not contain a variable x. The only condition that
exists for a point to be included
as a solution to the equation is that y must be -3.
|
Make a table of values: |
Plot the points and draw the line: |
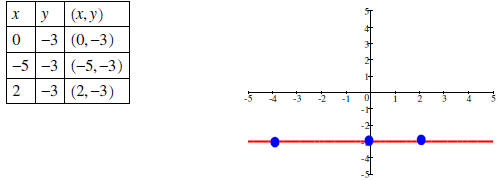 |
All points with y-coordinate -3 lie on the horizontal line
3 units below the x-axis.
In the following investigation you may use a
graphing calculator but record the table of values and the
graph of each equation on graph paper before graphing the next equation. As you
graph each equation,
observe the results before graphing the next equation.
• If you have a TI-82 or TI-83, you can enter the equation using the ”Y= ”
button on the top left of the
display. (You must solve the equation for y first.)
• Set the viewing window using the ”WINDOW” to the right of the ”Y ”
button.
• The following viewing window gives a FRIENDLY WINDOW:
 . xscl tells
you how many units you want each tick mark to represent.
 .1 will give a
SQUARE WINDOW .
• Otherwise, the range values can be manipulated to include the part of
the graph you want to see. You
can multiply each of the above settings to get other friendly and square
windows.
• If you do not use a friendly window, you will get large decimals when
you trace the graph using the
”TRACE” button. Use right and left arrows to move the cursor over the graph. The
”x =” and ”y= ” at
the bottom of the screen will give the coordinates of the point highlighted by
the cursor. The cursor
may skip over the integral x-intercepts if the window is not a friendly window.
Example 5: Graph the following lines on the same
coordinate system.

a) Which number was different in each equation? What effect did this have on the
graph?
b) Which number was the same in each equation? What did each line have in
common?
Solution:
a) The coefficient of x was different in each equation . The coefficient of x
affected the steepness of
the graph.
b) The constant was 1 in each equation. They all had a y-intercept of 1.
Example 6: Graph the following lines on the same
coordinate system.

a) Which number was different in each equation? What effect did this have on the
graph?
b) What number was the same in each equation? What did each line have in common?
Solution:
a) The constant was different in each equation. The y-intercepts were different
in each line.
b) The coefficient of x was 1 in each equation. Each line had the same
steepness.
Example 7: Graph the following lines on the same
coordinate system and compare with the lines in
Example 5. What is different between the equation of the lines in this example
and the lines in Example 5?
What effect did this difference have on the graphs ?

Solution: The coefficients of x in Example 5 are positive , but they are negative
in this example. Graphs in
Example 5 go uphill from left to right. Graphs in this example go downhill from
left to right.
Conclusions:
Graphs of lines in the form  .
.
• m, the coefficient of x, affects the steepness of the line. The larger
|m|, the steeper the line.
When m > 0, the line goes uphill from left to right. We say the line is
increasing.
When m < 0, the line goes downhill from left to right. We say the line is
decreasing.
• The number b is the y-intercept. If x = 0, then